Unemployment
5.45
% of labour force · 2025
modelled
-0.04 percentage points from 2024 to 2025.
Explore annual values · SourceAI-specific country records and supporting context for Kenya, kept separate. 3 of three AI pillars have a country record.
5 AI-specific indicators; 6 of six context measures reported.37.0 % of tasks
modelled Academic research · Tier 2 · 2026
Garg, Crosta and Baier, Global Automation Atlas (2026)
Tasks rated 2 or 3 on a 0-3 exposure scale, relabelled under each country's conditions. Not employment-weighted and not a share of jobs.
Recompute from data/jobs-atlas-exposure.csv.
0.2 index (0-1)
modelled Academic research · Tier 2 · 2026
Garg, Crosta and Baier, The Jagged Global Economy (2026)
Employment-share-weighted average exposure of a country's occupational structure.
Recompute from data/jobs-exposure.csv.
146 % of a monthly minimum wage
modelled Derived from academic and official inputs · Tier 2 · 2026-05-01
Computed from Claude Opus 5 (Anthropic) rate card and the statutory minimum wage
A month of moderate use = 20 standard workloads at the median frontier rate card ($11.25 per workload), divided by the monthly statutory minimum wage.
Recompute from data/affordability.csv.
123 % of monthly GNI per capita
modelled Derived from reported pricing and official economic data · Tier 4 · 2025
Computed from Claude Opus 5 rate card and World Bank GNI per-capita data
20 standard workloads at the median frontier rate card ($11.25 per workload), divided by monthly GNI per capita on the Atlas method (annual value divided by 12). Published only when the latest non-empty GNI observation is within the five-calendar-year freshness window.
Recompute from data/affordability.csv.
This records a country appearing on a provider's published geographic support list. It does not test signup, payment, every plan or feature, or service uptime. API and consumer products are separate.
| Provider | Product | Published status | Evidence |
|---|---|---|---|
| OpenAI | ChatGPT web and mobile | Listed as supported | Official list |
| OpenAI | OpenAI API | Listed as supported | Official list |
| Anthropic | Claude.ai web and mobile | Listed as supported | Official list |
| Anthropic | Anthropic commercial API | Listed as supported | Official list |
| Gemini web app | Listed as supported | Official list | |
| Google AI Studio and Gemini API | Listed as supported | Official list |
Download the full source register.
These records describe the stated signup, card and payment evidence for sampled countries. They are separate from official geographic support lists and do not calculate affordability.
| Provider | Signup status | Evidence |
|---|---|---|
| OpenAI | yes | Source |
| Anthropic | yes | Source |
| yes | Source | |
| xAI | unclear | Source |
| Perplexity | unclear | Source |
| DeepSeek | unclear | Source |
6.4 MW named (all delivery statuses)
announced News reporting · Tier 4 · 2026
Observatory infrastructure register
Sum of published capacity in the register. Projects without a published capacity figure are excluded, never counted as zero. This inventory total includes all labelled delivery statuses; it is not operational supply. Use the status breakdown for operating capacity.
Recompute from data/infrastructure.json.
Connectivity and power conditions help explain the environment for digital services. These are not AI-use, AI-adoption or data-centre-capacity measures. Each value keeps its source year.
| Measure | Value / status | Year | Source |
|---|---|---|---|
| Individuals using the Internet (% of population) IT.NET.USER.ZS | 35.0 % of population | 2024 | World Bank API |
| Mobile cellular subscriptions (per 100 people) IT.CEL.SETS.P2 | 126.5 subscriptions per 100 people | 2024 | World Bank API |
| Fixed broadband subscriptions (per 100 people) IT.NET.BBND.P2 | 3.0 subscriptions per 100 people | 2024 | World Bank API |
| Measure | Value / status | Year | Source |
|---|---|---|---|
| Access to electricity (% of population) EG.ELC.ACCS.ZS | 77.0 % of population | 2024 | World Bank API |
| Firms experiencing electrical outages (% of firms) IC.ELC.OUTG.ZS | 74.6 % of firms | 2025 | World Bank API |
| Value lost due to electrical outages (% of sales for affected firms) IC.FRM.OUTG.ZS | 0.0 % of sales among firms affected | 2025 | World Bank API |
Download all country context values and source links.
Signals whose headline names this country, newest first. Tags say what kind of source each one is.
This profile exists for every African country in InferenceAfrica's geographic scope. The AI-specific indicator count excludes the context table. “No information” means no country-level value or record was available in the named dataset; it does not mean zero or prove that no information exists elsewhere.
AI-specific figures come from the indicator registry and pillar registers. The separate context snapshot uses World Bank API indicators, with the originating ITU, ESMAP and Enterprise Surveys sources named in the downloadable file. Every context row links to its country-specific API query. Product geography is separately transcribed from the cited providers' supported-region lists, retrieved 25 September 2026. Read the matching method and limitations.
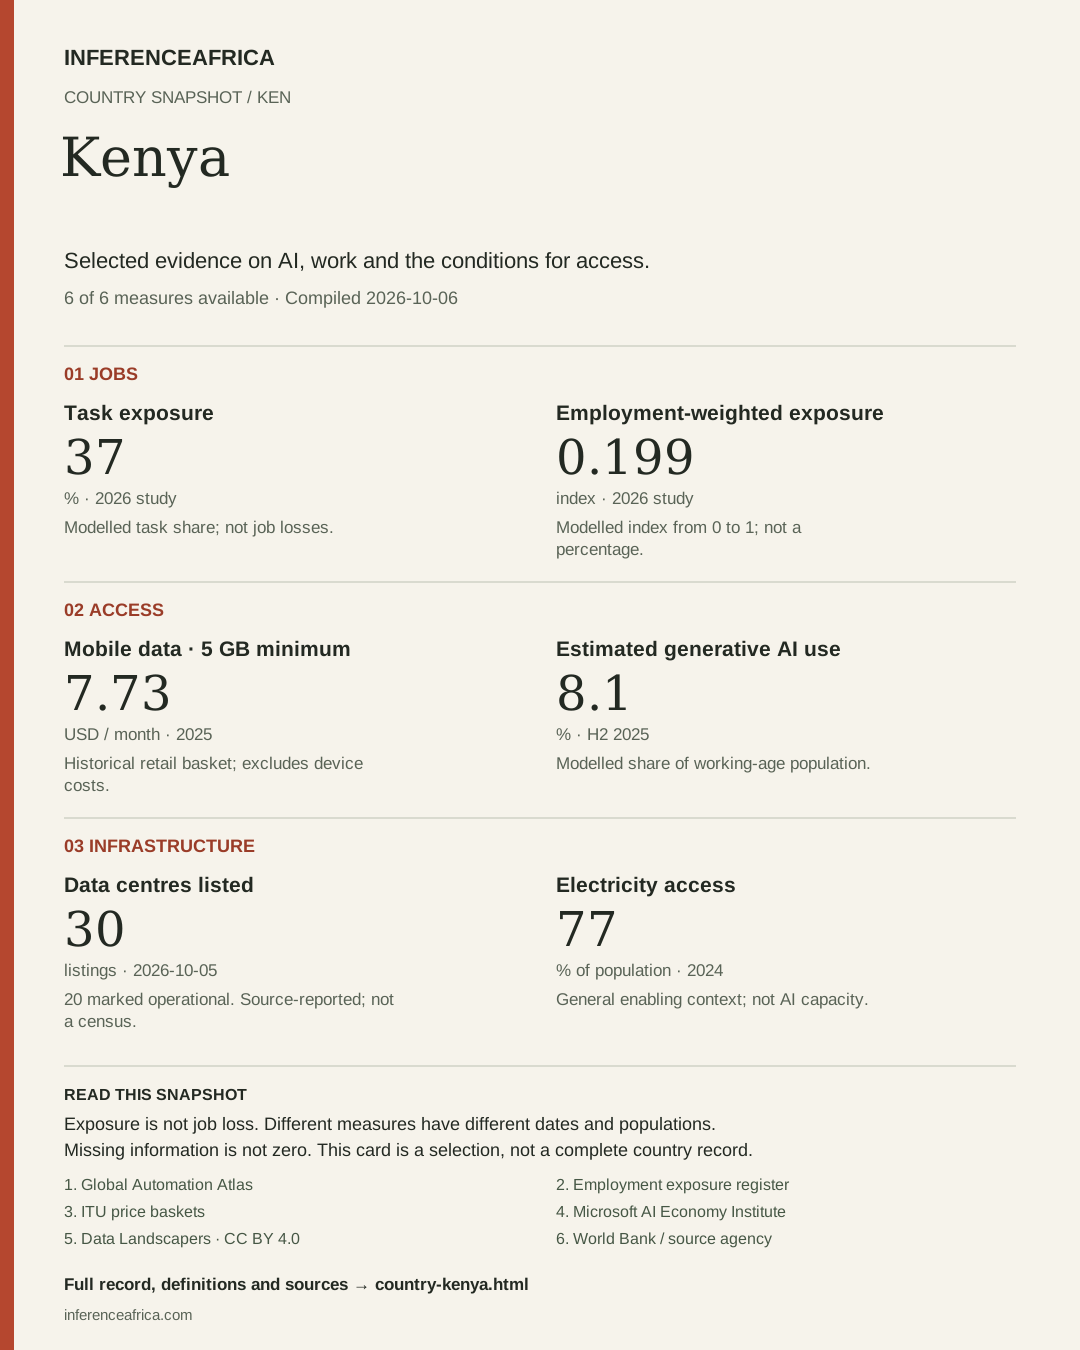
A country in one page
Six selected measures, with dates and sources. Use the full country profile for the complete record.
Portrait · 4:5 format
PNG: 2160 × 2700 pixels
SVG: editable vector artwork
The export uses a fixed light background for readable sharing. Unknown values stay labelled; no country score is calculated.
AI and the economy
Economic context helps interpret AI activity. These figures do not measure AI’s effect on employment or growth. Observation years vary; ILO labour estimates are modelled. Missing observations remain missing.
No comparable AI hiring figure in this register. This does not mean there are no AI jobs. Job-board coverage, duplicate adverts and remote roles need review before national comparisons.
5.45
% of labour force · 2025
modelled
-0.04 percentage points from 2024 to 2025.
Explore annual values · Source15.25
% of labour force aged 15–24 · 2025
modelled
-0.23 percentage points from 2024 to 2025.
Explore annual values · Source67.39
% of population aged 15+ · 2025
modelled
-0.03 percentage points from 2024 to 2025.
Explore annual values · Source4.63
annual % · 2025
reported
-0.03 percentage points from 2024 to 2025.
Explore annual values · Source2,362.86
current USD · 2025
reported
+229.40 current USD from 2024 to 2025.
Explore annual values · Source4.07
annual % · 2025
reported
-0.42 percentage points from 2024 to 2025.
Explore annual values · SourceDownload annual economic context. GDP per capita is not personal income. Low unemployment can coexist with informal or low-paid work.
Infrastructure · Facility directory
Source-reported directory listings, not a national census. Includes commercial, government, enterprise and research facilities. Source claims have not been independently verified by InferenceAfrica. Campuses may contain multiple facilities. Do not add these counts or capacities to the project register.
Adapted from Data Landscapers, edition 2026-10-05-2, CC BY 4.0. Fields selected and counts calculated by InferenceAfrica. Download the full directory · Chart country counts.
Collection round · 2026-10-01
This collection preserves each source’s population, period and definition. Estimates, survey responses, vacancies and provider claims remain separate. Coverage is incomplete.
Survey percentages describe respondents; telemetry estimates use a different denominator. The five-country employee sample has no country-level breakdown here.
Any AI tool or application, Q3. Online survey respondents aged 18+; not all residents, and not restricted to work use. Country sample approximately 1,000.
2025 fieldwork; use in preceding 12 months · survey · measured · Google / Ipsos Our Life With AI, 2025 fieldwork
Online non-probability survey, approximately 1,000 adults per country; fieldwork 22 September–10 October 2025. Self-reported use. Results describe the surveyed sample and must not be presented as a census of all residents.
Make a chart from this measure
| Scope | Value | Meaning and limits |
|---|---|---|
| Kenya | No information in this source | No information: country outside this survey’s African sample. |
Generative AI tools or generation of images, video or audio, Q4. Same online survey and fieldwork as the all-AI measure; a different question.
2025 fieldwork; use in preceding 12 months · survey · measured · Google / Ipsos Our Life With AI, 2025 fieldwork
Online non-probability survey, approximately 1,000 adults per country; fieldwork 22 September–10 October 2025. Self-reported use. Results describe the surveyed sample and must not be presented as a census of all residents.
Make a chart from this measure
| Scope | Value | Meaning and limits |
|---|---|---|
| Kenya | No information in this source | No information: country outside this survey’s African sample. |
Generative-AI diffusion estimate adjusted from Microsoft telemetry for device/OS market share, internet penetration and population. Working-age denominator; not a direct population survey or a measure of workplace adoption. Appendix pp. 15–17.
H1 2025 · vendor_estimate · modelled · Microsoft AI Economy Institute, Global AI Adoption in 2025
Generative-AI diffusion estimate adjusted from Microsoft telemetry for device/OS market share, internet penetration and population. Working-age denominator; not a direct population survey or a measure of workplace adoption. Appendix pp. 15–17.
Make a chart from this measure
| Scope | Value | Meaning and limits |
|---|---|---|
| Kenya | 7.8 % of working-age population | Generative-AI diffusion estimate adjusted from Microsoft telemetry for device/OS market share, internet penetration and population. Working-age denominator; not a direct population survey or a measure of workplace adoption. Appendix pp. 15–17. |
Generative-AI diffusion estimate adjusted from Microsoft telemetry for device/OS market share, internet penetration and population. Working-age denominator; not a direct population survey or a measure of workplace adoption. Appendix pp. 15–17.
H2 2025 · vendor_estimate · modelled · Microsoft AI Economy Institute, Global AI Adoption in 2025
Generative-AI diffusion estimate adjusted from Microsoft telemetry for device/OS market share, internet penetration and population. Working-age denominator; not a direct population survey or a measure of workplace adoption. Appendix pp. 15–17.
Make a chart from this measure
| Scope | Value | Meaning and limits |
|---|---|---|
| Kenya | 8.1 % of working-age population | Generative-AI diffusion estimate adjusted from Microsoft telemetry for device/OS market share, internet penetration and population. Working-age denominator; not a direct population survey or a measure of workplace adoption. Appendix pp. 15–17. |
Vacancy advertisements indicate hiring demand. Comparable national wage, hiring and net-employment effects remain a research gap.
Pnet report, page 7: year-on-year growth in AI-related advertisements. Platform scope includes international/remote listings. This is a demand signal; it does not measure hires, net employment, wages or a causal effect of AI.
H1 2025 versus H1 2024 · platform_records · measured · Pnet Job Market Trends, August 2025
Change in AI-related vacancies observed by Pnet. A vacancy is an advertisement, not a hire or net job creation. The report includes international and remote listings; it is not a census of domestic employment.
Make a chart from this measure
| Scope | Value | Meaning and limits |
|---|---|---|
| Kenya | No information in this source | No information: outside this platform report’s country scope. |
No statistically significant average business-performance effect in the reported entrepreneur experiment. This is not evidence of a zero effect or a national jobs outcome. Research source.
These are ITU’s 2025 observations, including the new 5 GB mobile basket. Local device prices and verified payment conditions remain to be collected.
ITU 2025 retail basket, selected under its representative-operator rules. At least 5 GB; actual allowance may be higher. Historical observation, not a current quote. The 5 GB mobile basket must not be spliced into the older 2 GB series. Connection charges and device costs are not added to this monthly figure.
2025 · official · measured · ITU ICT Price Baskets, December 2025 release
Retail basket prices collected under ITU rules; country prices are published in USD and as a share of monthly GNI per capita. Basket definitions changed in 2025.
Make a chart from this measure
| Scope | Value | Meaning and limits |
|---|---|---|
| Kenya | 7.73 USD per month | ITU 2025 retail basket, selected under its representative-operator rules. At least 5 GB; actual allowance may be higher. Historical observation, not a current quote. The 5 GB mobile basket must not be spliced into the older 2 GB series. Connection charges and device costs are not added to this monthly figure. Selected operator: Safaricom. Plan allowance: 5 GB. Tax rate as published: 31. |
ITU 2025 retail basket, selected under its representative-operator rules. At least 5 GB; actual allowance may be higher. Historical observation, not a current quote. The 5 GB mobile basket must not be spliced into the older 2 GB series. Income ratio uses ITU’s own GNI denominator and release, which can differ from this Observatory’s AI-price income base.
2025 · official · measured · ITU ICT Price Baskets, December 2025 release
Retail basket prices collected under ITU rules; country prices are published in USD and as a share of monthly GNI per capita. Basket definitions changed in 2025.
Make a chart from this measure
| Scope | Value | Meaning and limits |
|---|---|---|
| Kenya | 4.1 % of monthly GNI per capita | ITU 2025 retail basket, selected under its representative-operator rules. At least 5 GB; actual allowance may be higher. Historical observation, not a current quote. The 5 GB mobile basket must not be spliced into the older 2 GB series. Income ratio uses ITU’s own GNI denominator and release, which can differ from this Observatory’s AI-price income base. Selected operator: Safaricom. Plan allowance: 5 GB. Tax rate as published: 31. |
ITU 2025 retail basket, selected under its representative-operator rules. At least 5 GB; actual allowance may be higher. Historical observation, not a current quote. Connection charges and device costs are not added to this monthly figure.
2025 · official · measured · ITU ICT Price Baskets, December 2025 release
Retail basket prices collected under ITU rules; country prices are published in USD and as a share of monthly GNI per capita. Basket definitions changed in 2025.
Make a chart from this measure
| Scope | Value | Meaning and limits |
|---|---|---|
| Kenya | 23.19 USD per month | ITU 2025 retail basket, selected under its representative-operator rules. At least 5 GB; actual allowance may be higher. Historical observation, not a current quote. Connection charges and device costs are not added to this monthly figure. Selected operator: Safaricom PLC. Plan allowance: Unlimited GB. Tax rate as published: 31. |
ITU 2025 retail basket, selected under its representative-operator rules. At least 5 GB; actual allowance may be higher. Historical observation, not a current quote. Income ratio uses ITU’s own GNI denominator and release, which can differ from this Observatory’s AI-price income base.
2025 · official · measured · ITU ICT Price Baskets, December 2025 release
Retail basket prices collected under ITU rules; country prices are published in USD and as a share of monthly GNI per capita. Basket definitions changed in 2025.
Make a chart from this measure
| Scope | Value | Meaning and limits |
|---|---|---|
| Kenya | 12.29 % of monthly GNI per capita | ITU 2025 retail basket, selected under its representative-operator rules. At least 5 GB; actual allowance may be higher. Historical observation, not a current quote. Income ratio uses ITU’s own GNI denominator and release, which can differ from this Observatory’s AI-price income base. Selected operator: Safaricom PLC. Plan allowance: Unlimited GB. Tax rate as published: 31. |
No information in reviewed sources means the checked sources supplied no figure. Not yet researched means a country-specific search is still pending. Neither means zero.
| Country | Area | Review state | Remaining work |
|---|---|---|---|
| Kenya | AI use and adoption | Modelled estimate only | National business-adoption and usage-frequency measures remain uncollected. Pooled employee survey is not allocated to countries. |
| Kenya | Employment outcomes and hiring demand | Related study; no national jobs result | Comparable country-level wages, hires and causal net employment outcomes have not been established in this collection round. |
| Kenya | Practical access costs | Price evidence available | ITU 2025 baskets checked. Current local device retail prices and verified payment checkout conditions remain uncollected. |
| Kenya | Operating facilities and compute services | Not yet researched | This is a starter sample, not a facility census. GPU counts, current rental quotes and latency measurements remain gaps. |
Download observations CSV · Compute evidence CSV · Research coverage CSV · Definitions and provenance JSON
Collection method and remaining work · Collection revisions
Compare records, build a chart and download your selection in the Data Explorer.
Open Data Explorer →Source-reviewed additions retain their original geography and period. Forecasts are not realised outcomes. Download evidence CSV.
| Measure | Scope | Value | Period and status | Limits and source |
|---|---|---|---|---|
| Connected mobile devices in Kenya | Kenya - smartphones | = 52,260,000 connections | June 2026 (end of Q4 FY2025/26) · measured | Connections recorded by the Communications Authority of Kenya sector statistics, as reported by TechTrendsKE. Device connections are not people and not unique users: one person or business may hold several connections. Publication date is not the observation date. Stated 4.2% increase from 50.18 million in March 2026. Source |
| Connected mobile devices in Kenya | Kenya - feature phones | = 27,420,000 connections | June 2026 (end of Q4 FY2025/26) · measured | Connections recorded by the Communications Authority of Kenya sector statistics, as reported by TechTrendsKE. Device connections are not people and not unique users: one person or business may hold several connections. Publication date is not the observation date. Stated 3.9% decrease over the quarter. Source |
| Connected mobile devices in Kenya | Kenya - all connected mobile devices | = 79,680,000 connections | June 2026 (end of Q4 FY2025/26) · measured | Connections recorded by the Communications Authority of Kenya sector statistics, as reported by TechTrendsKE. Device connections are not people and not unique users: one person or business may hold several connections. Publication date is not the observation date. Smartphones and feature phones combined as reported, a 65.6% smartphone share of the device base. Not a population, subscriber or household count. Source |
| Connected mobile devices in Kenya | Kenya - smartphones | = 50,180,000 connections | March 2026 (end of Q3 FY2025/26) · measured | Connections recorded by the Communications Authority of Kenya sector statistics, as reported by TechTrendsKE. Device connections are not people and not unique users: one person or business may hold several connections. Publication date is not the observation date. Prior-quarter comparison point reported in the same article. Source |
| Teachers trained under Kenya's Digital Literacy Programme | Kenya | > 62,000 teachers trained (cumulative) | cumulative as at 2026-09-24 · measured | Cumulative national figure attributed to the ICT Authority for Phase II of the Digital Literacy Programme (KDEAP, with World Bank support). Trained teachers are not equipment delivered, classroom use or learning outcomes. Phase II targets 10,382 public junior schools across 47 counties: that is a planned scope, not a delivered count, and is not recorded as an observation. Source |